History
Open History in your Nexus project to review test results and investigate what happened during a run. The three tabs let you start with a build, a test plan execution, or an individual test run.
| Tab | Use it to |
|---|---|
| Builds | Review results for a build and open its test plan executions or runs. |
| Test Plan Runs | Review an execution of a test plan and open the runs it contains. |
| Runs | Find a finished run and open its report, recording, or details. |
Test Plan Runs appears when Test Plans is enabled for the project. Each tab provides search, filters, and pagination to help you find the results you need.
Builds
The Builds tab groups test results by build. Use it to check a particular release or investigate results across builds.
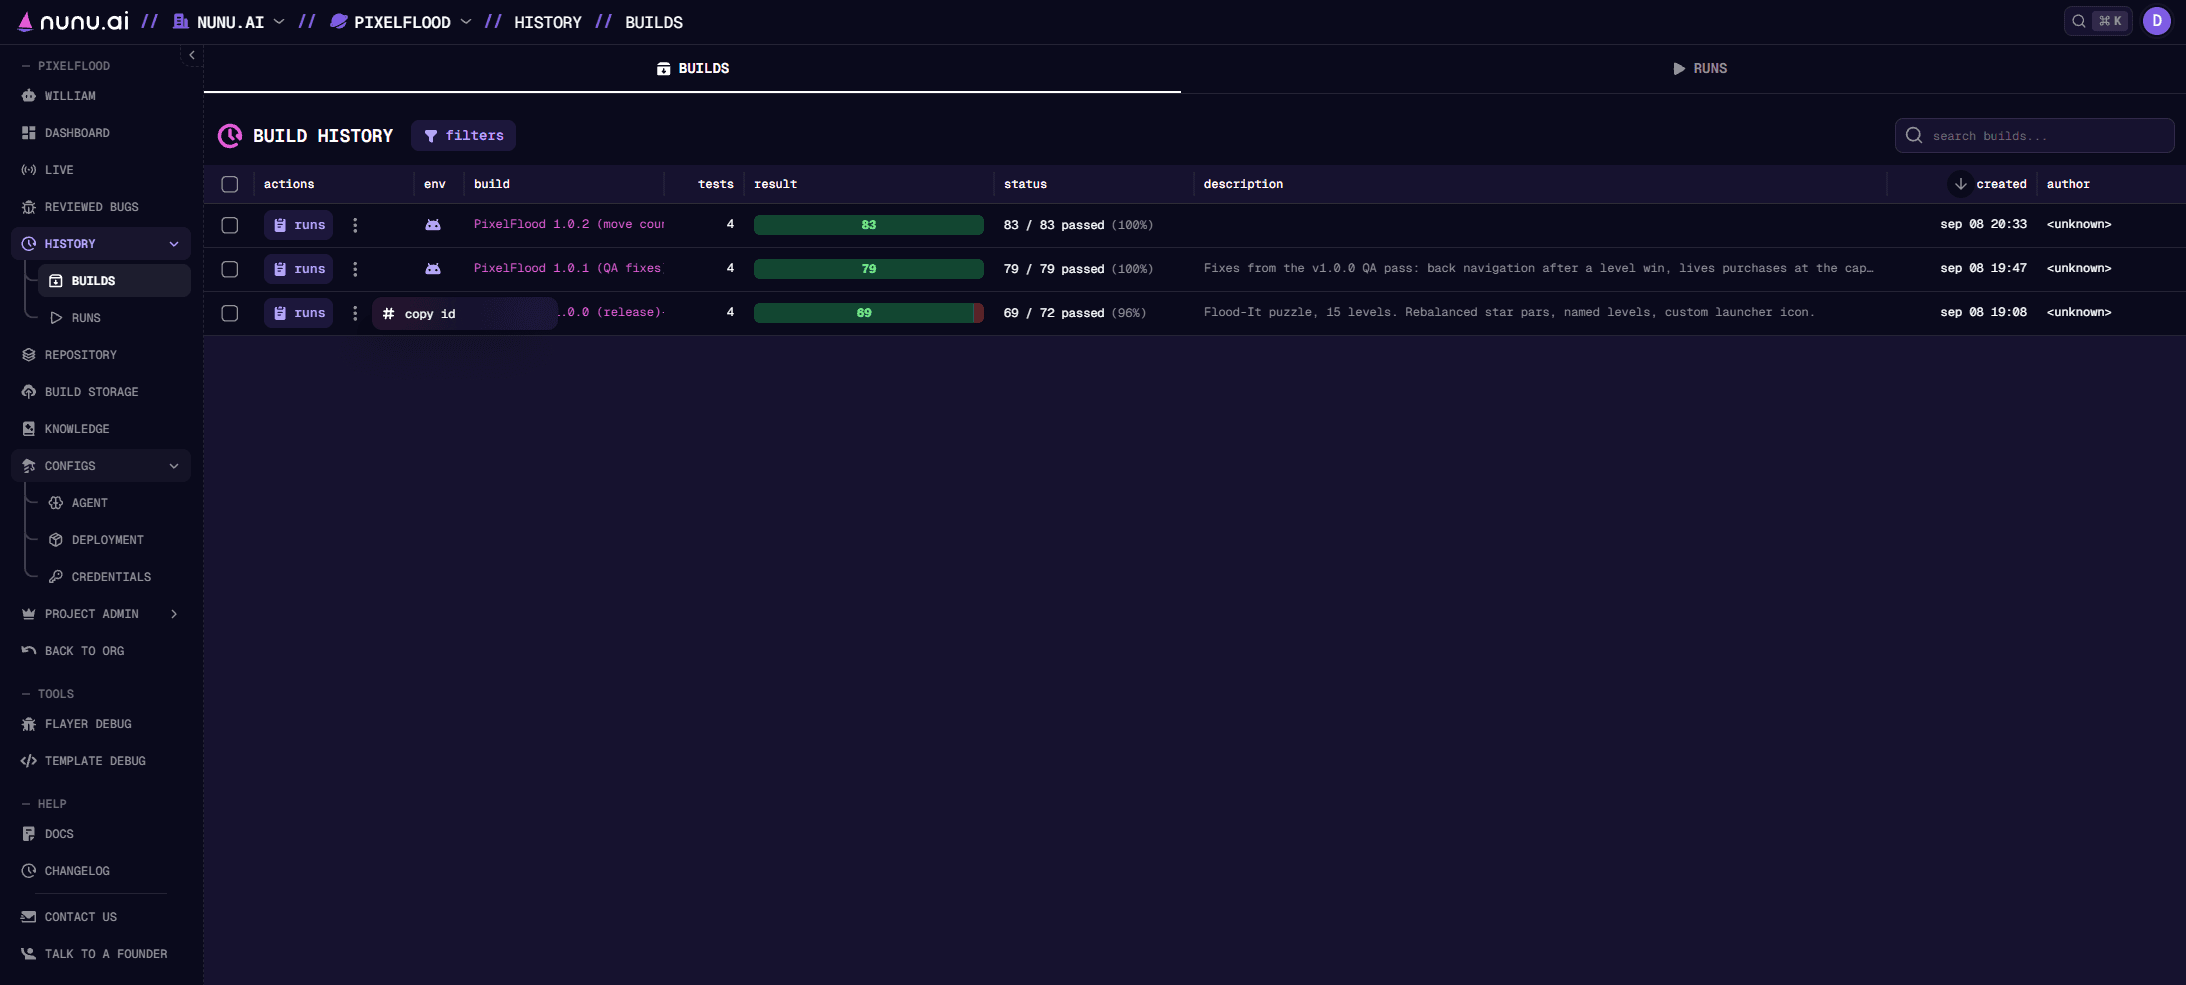
Click runs on a build to inspect its individual runs. When Test Plans is enabled, test plans opens executions for that build. Use the ⋮ menu to copy the build ID.
Tests counts the tests run on the build. For verification tests, result and status summarize individual checks, so their totals can be higher than the test count. Status shows the passed count and percentage; hover over a result segment to see its count. Builds without a verification check summary show passed and failed test totals.
Search by build name, description, or author. Filters also cover creation date, total tests, and platform.
When performance data is available, Recent Builds: Performance shows a chart above the table. This summary uses runs tagged performance.
Test Plan Runs
The Test Plan Runs tab lists executions of your test plans. Each row represents an execution, so you can review the same plan across different builds or dates.
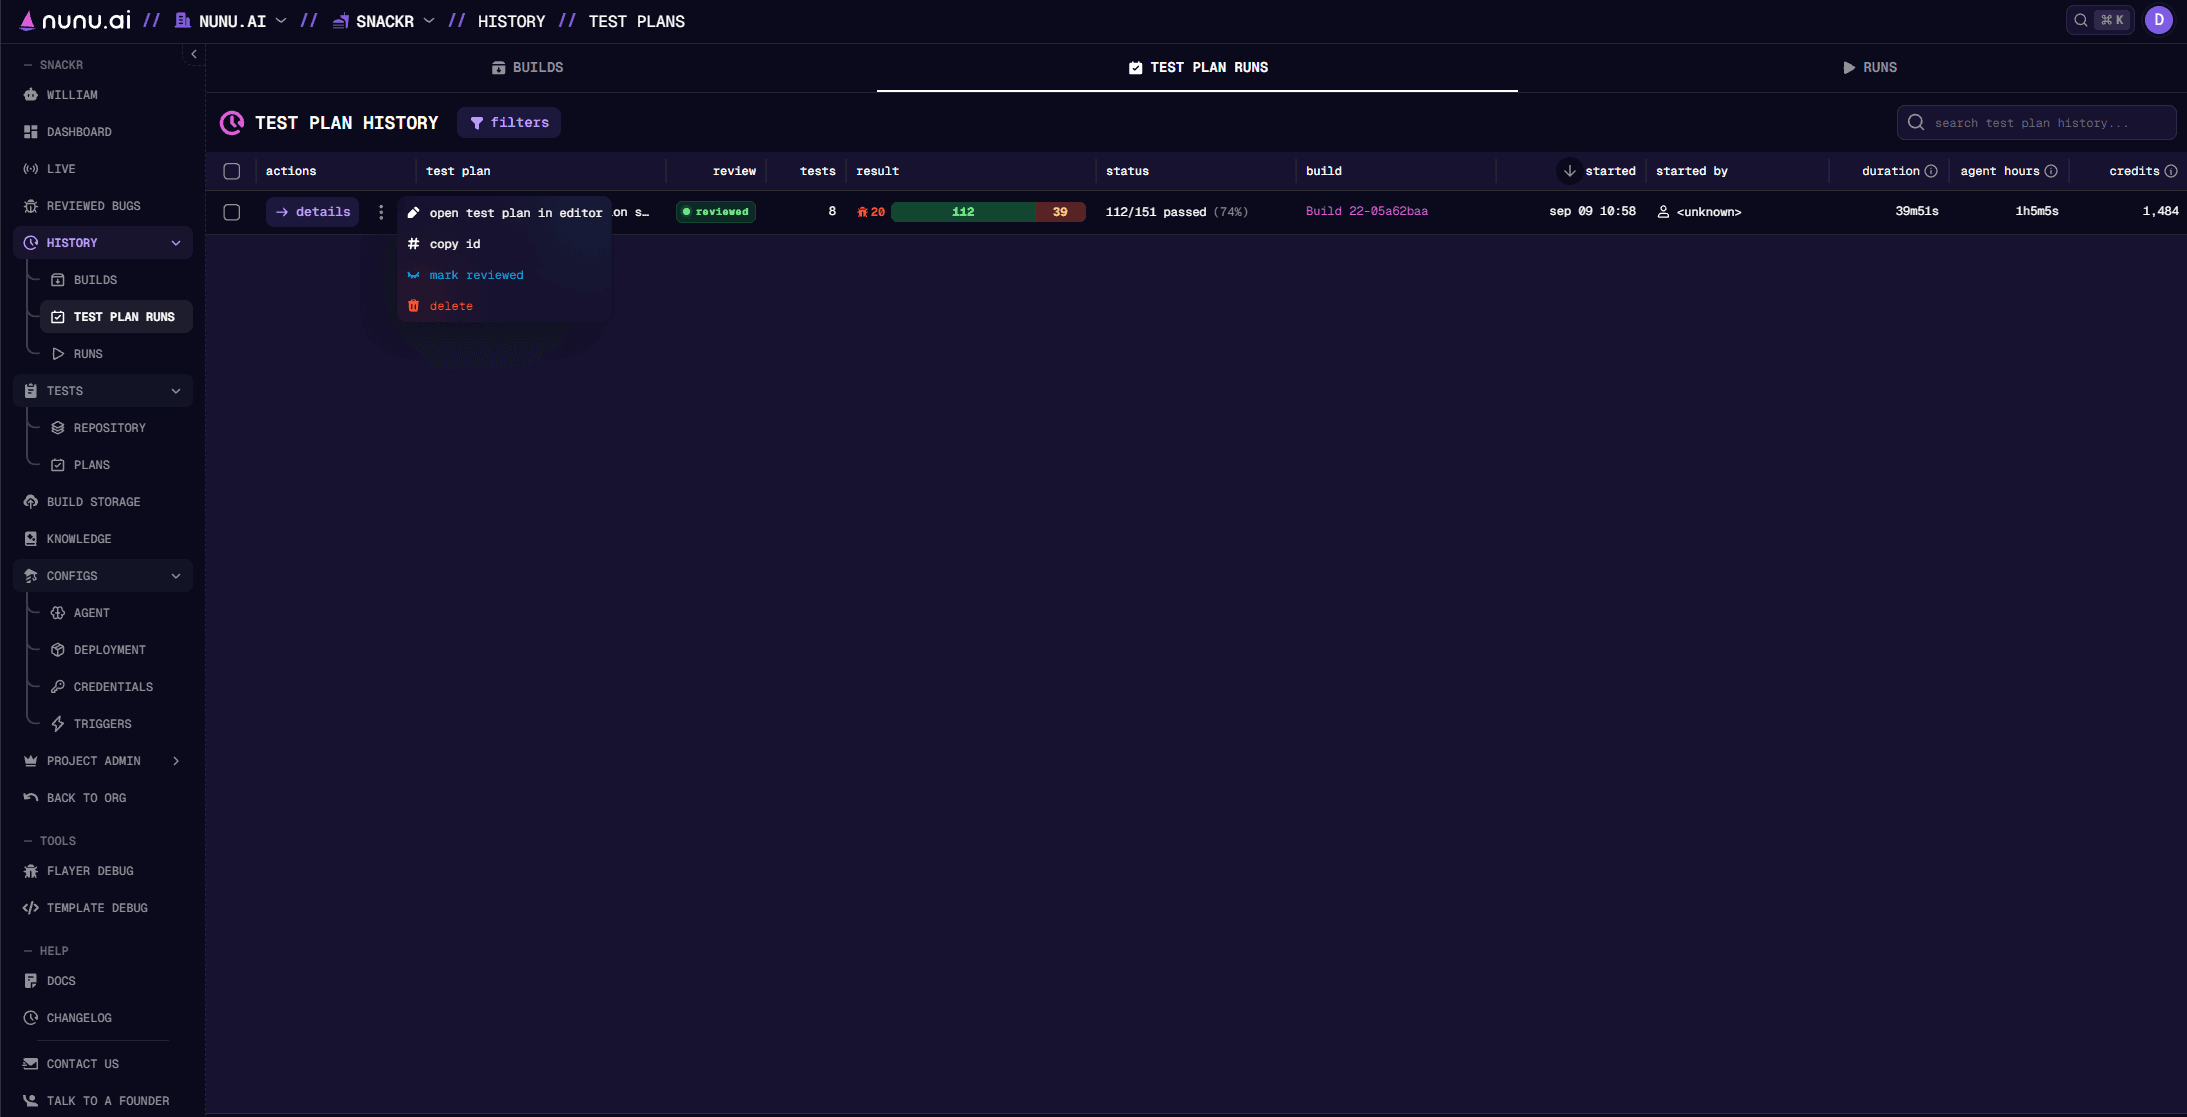
Click details to open the Runs tab filtered to this execution. The ⋮ menu lets you open the plan in the editor or copy the execution ID.
Result and status summarize the execution’s outcomes and passed percentage. Ongoing executions show pending tests. Finished executions show verification check outcomes when available, so the result total can be higher than the tests count.
| Metric | Meaning |
|---|---|
| duration | Elapsed time from the start to the end of the execution. |
| agent hours | Total time used by all agents in the execution. |
| credits | Credits used by the execution’s runs, shown when the execution finishes. |
Duration and agent hours measure different things. Agents running in parallel contribute to the total agent time while sharing the same elapsed time.
Search by test plan name, or filter by start date and build name. Projects with bug review status enabled also show a review column and a pending-review filter.
The filtered Runs view includes execution context and an only newest of each test toggle. Turn it off to see earlier attempts, including retries.
Runs
The Runs tab lists finished runs, including runs that complete, stop, time out, or encounter an error. Follow queued and active runs in Live View.
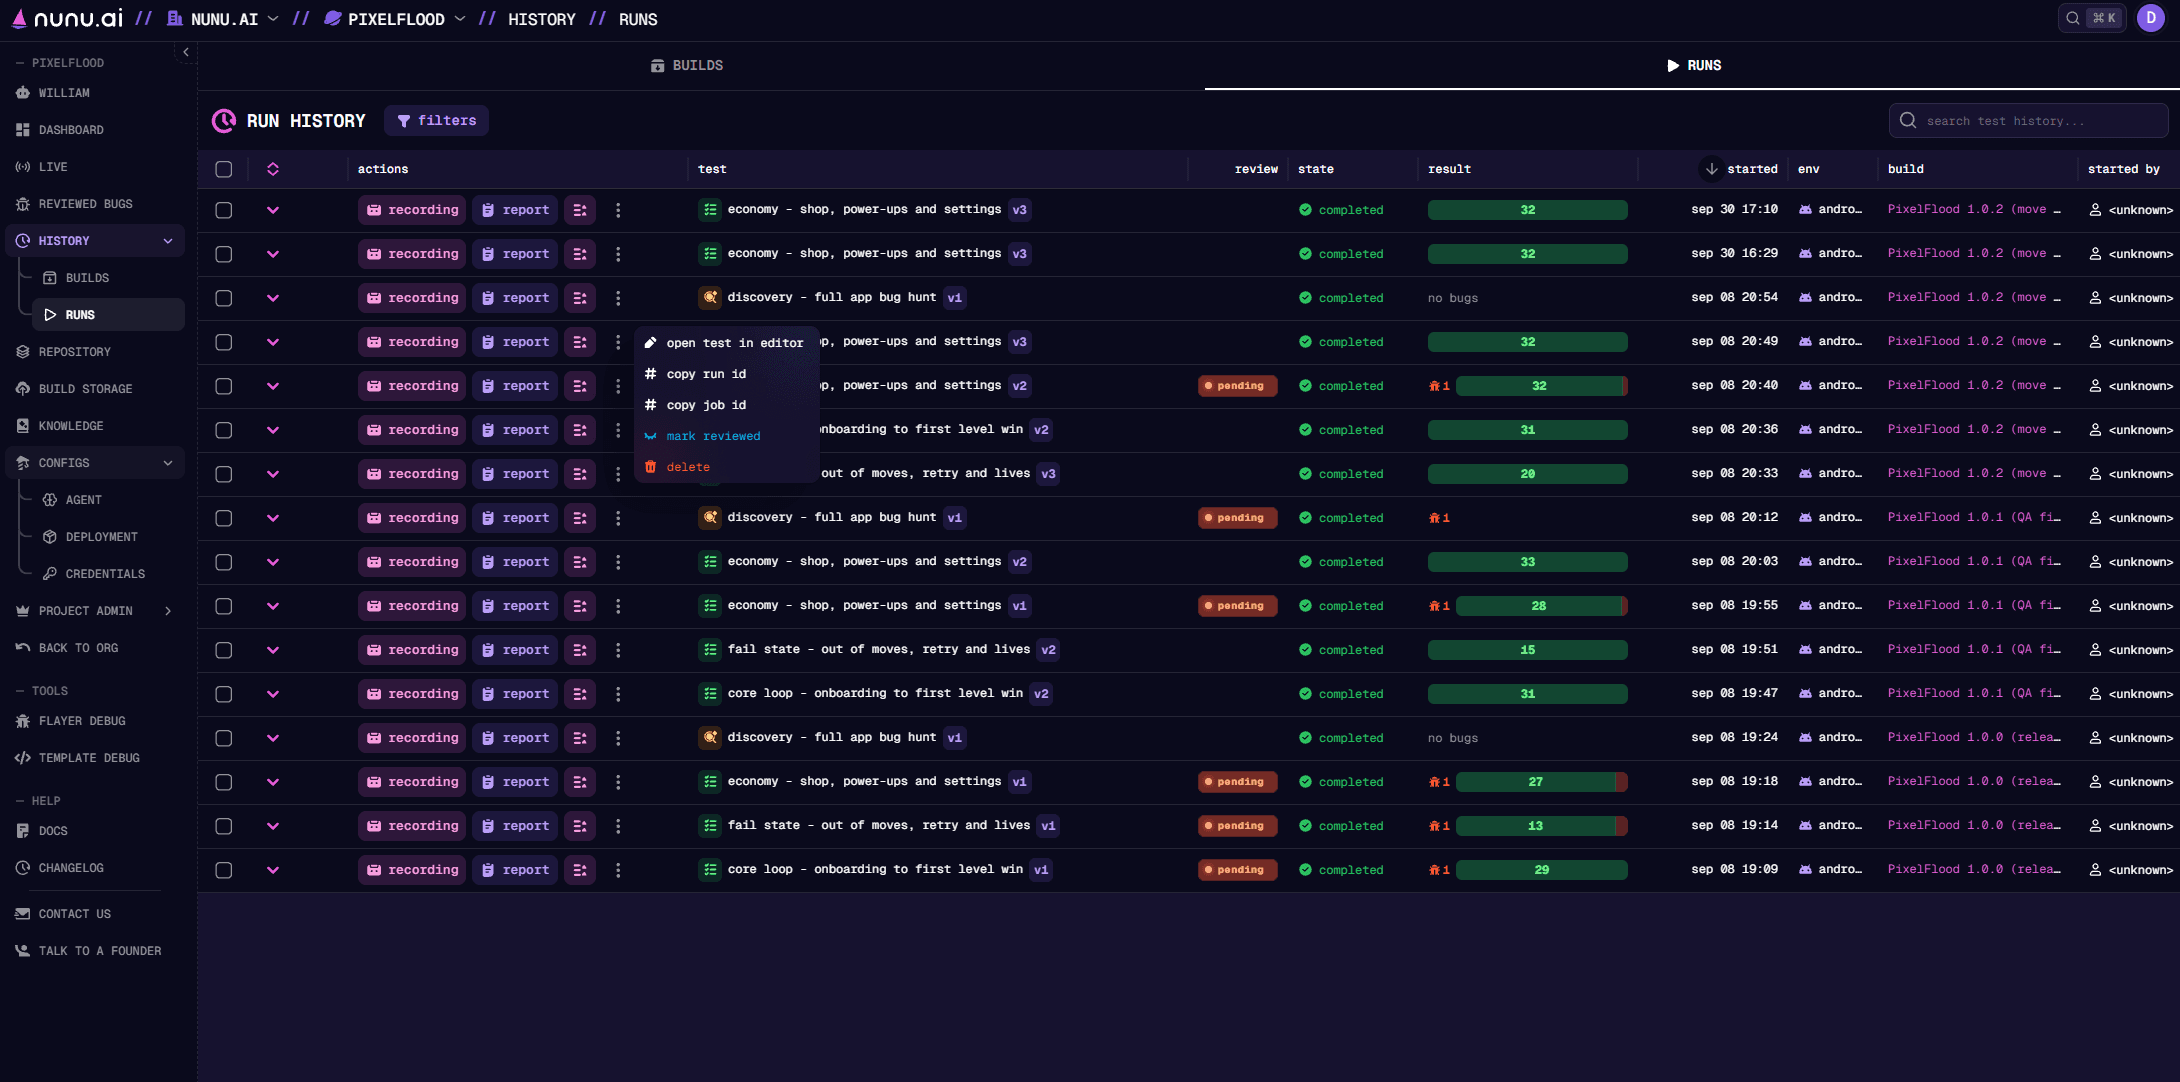
Search by test name, or filter by tags, build name, date, platform, and initiator. Projects with bug review status enabled also provide a pending-review filter.
Expand a row with its chevron to inspect the steps. Multiplayer rows expand into players, whose steps you can inspect separately.
When you open runs from a build or test plan execution, only newest of each test is enabled by default. Turn it off to inspect all attempts.
State and Result
State describes how execution ends. Result shows the test’s findings and recorded outcomes. A run with state completed can have failed checks.
| State | Meaning |
|---|---|
| completed | The run reaches its verdict. |
| stopped | A user stops the run. Hover over the information icon for the reason and initiator. |
| timeout | Execution reaches a time limit. Hover over the information icon for the code and message. |
| error | An execution error occurs, such as a crash. Hover over the information icon for the code and message. |
Results depend on the test type:
- Verification runs show a summary of check outcomes. Checks can be passed, failed, blocked, or skipped. Checks interrupted by a stop, timeout, or error show that outcome; unresolved checks in a finished run appear as canceled. Hover over summary segments for counts, then open Run Details to inspect individual checks and agent comments.
- Task runs show success when the goal is accomplished and no success when it is not. A verdict can also be blocked or skipped.
- Discovery runs show bug findings, including no bugs when a completed run finds none.
Blocked means a prerequisite or environmental condition prevents evaluation. Skipped means the agent intentionally leaves the work unexecuted. Verification verdicts combine step and check outcomes in this order: failed → blocked → passed → skipped. A failed check fails the run; a blocked outcome takes precedence over passing outcomes.
The bug badge shows findings alongside the result. A run can pass its checks and still find bugs. See Bug Review to inspect and triage those findings.
Run Actions
| Action | Use it to |
|---|---|
| recording | Replay the game and inspect the agent’s actions on a timeline. |
| report | Read the agent’s summary of the run and its findings. |
| details | Inspect run metadata, player steps and checks, and downloadable artifacts. |
| ⋮ | Open the test in the editor, copy run or job IDs, and access available review, export, and deletion actions. |
Review actions appear when the project enables bug review status. Export to TestRail appears when the integration is enabled. Deletion actions depend on your project permissions.
Run Details
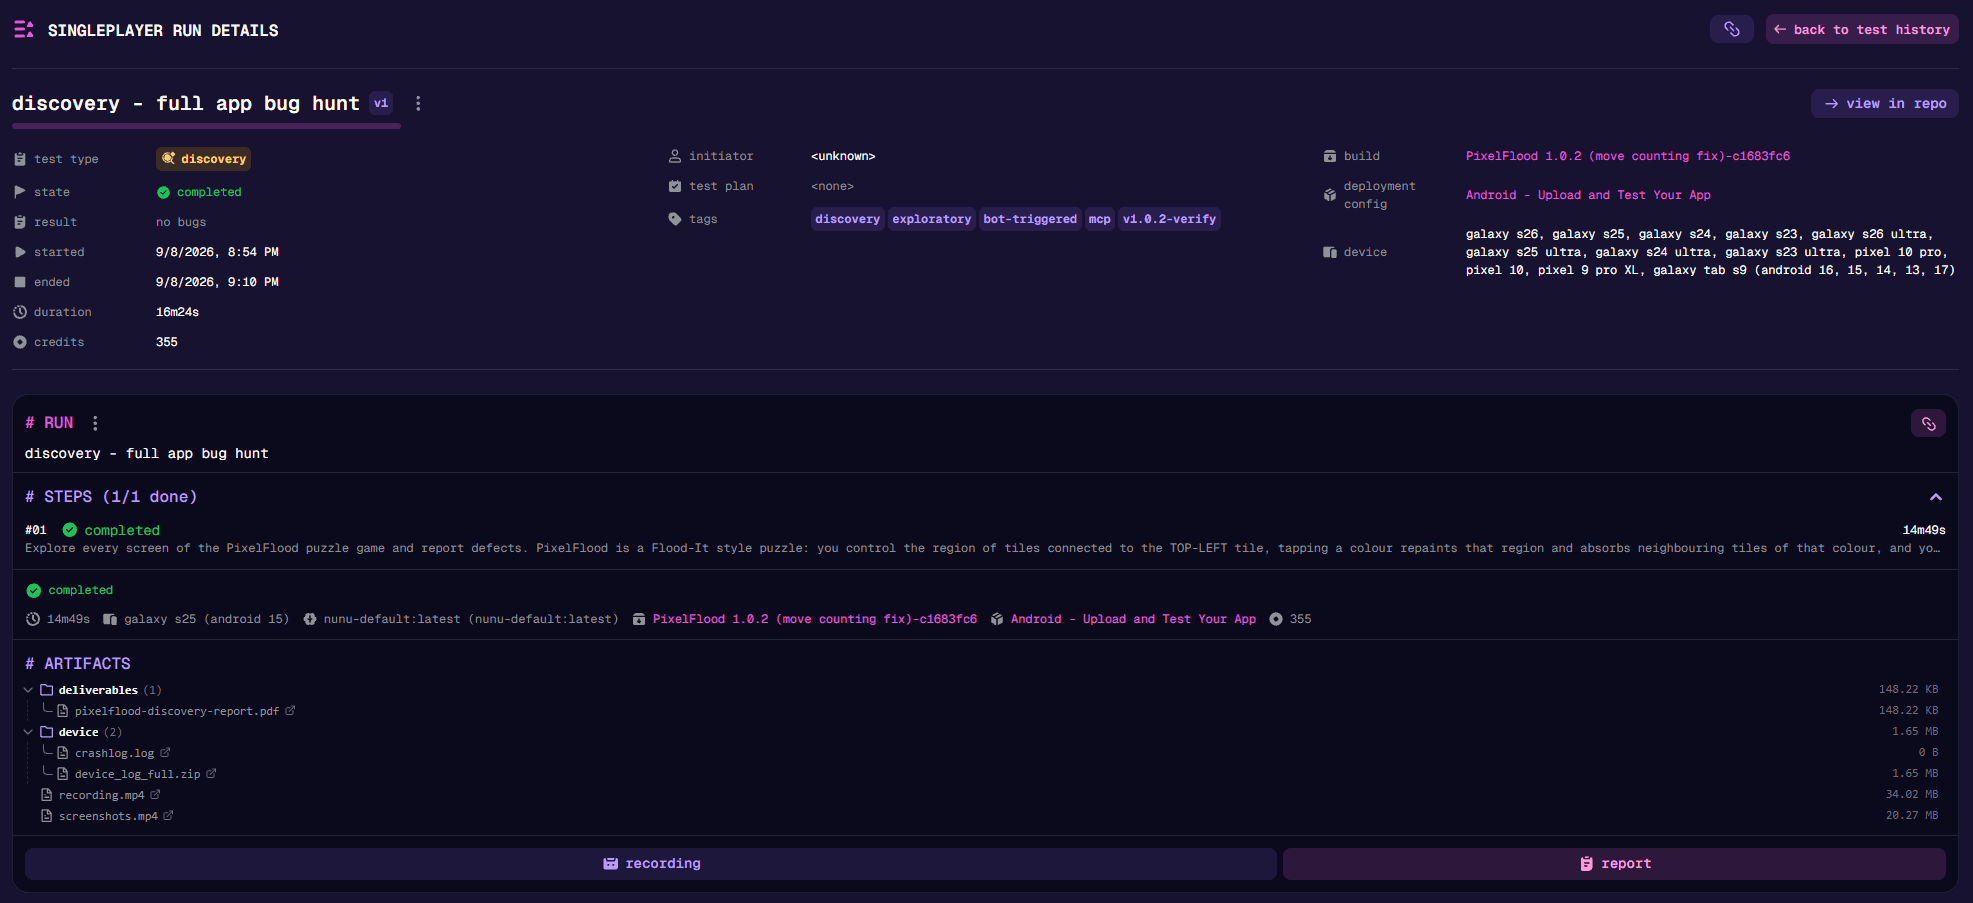
Click details on a run to open Singleplayer Run Details or Multiplayer Run Details. This page brings together the execution context, step results, and files you need to investigate a failure or share a result.
Run Metadata
The top of the page shows the test name and version, test type, state, result, verification summary, start and end times, and duration. It also shows the initiator, test plan, tags, build, deployment config, and device information. Credits and location settings appear when applicable.
Use the links to open runs for the same build or test plan, or inspect the deployment config. view in repo opens the test version used for this run.
Use the link button in the page header to copy the run details URL. The ⋮ menu beside the test name lets you copy the run ID, job ID, or associated test plan execution ID. back to test history returns to the Runs tab.
Player Steps and Checks
A singleplayer run has one Run card. A multiplayer run has a separate Player card for each participant, so you can inspect each player’s execution and environment.
Each card contains:
- Steps, with the step number, goal, outcome, duration, and bug findings.
- Expandable verification checks showing the expected result, outcome, and the agent’s comment when recorded. Use expand all checks or collapse all checks to control the entire card.
- Player-specific agent config, build, deployment config, device, duration, and applicable credit or location information. Cross-platform runs show each player’s own build and deployment config.
- recording and report actions for that player.
Start with the failed or blocked step, read its check comments, then open the player’s recording to inspect the events leading up to it.
Artifacts and Logs
The Artifacts section in each player card lists files collected from that player’s run in a folder tree. These can include logs, videos, screenshots, and custom output files, depending on the platform and test.
- Click a folder to expand it.
- Right-click a file and select download file to download it.
- Right-click a folder and select download folder to download its contents as an archive.
- Open the player card’s ⋮ menu and select download artifacts to download all of that player’s artifacts.
For log types and instructions on collecting custom files, see PC Logs & Artifacts, Mobile Logs & Artifacts, and Custom Output.
Recording
Open recording from the Runs table or a player card to review the game alongside the agent’s actions, tool calls, and results. Select an event on the timeline to inspect what happens at that point in the run. Switch between screenshots and video to compare the agent’s observations with the recorded session.
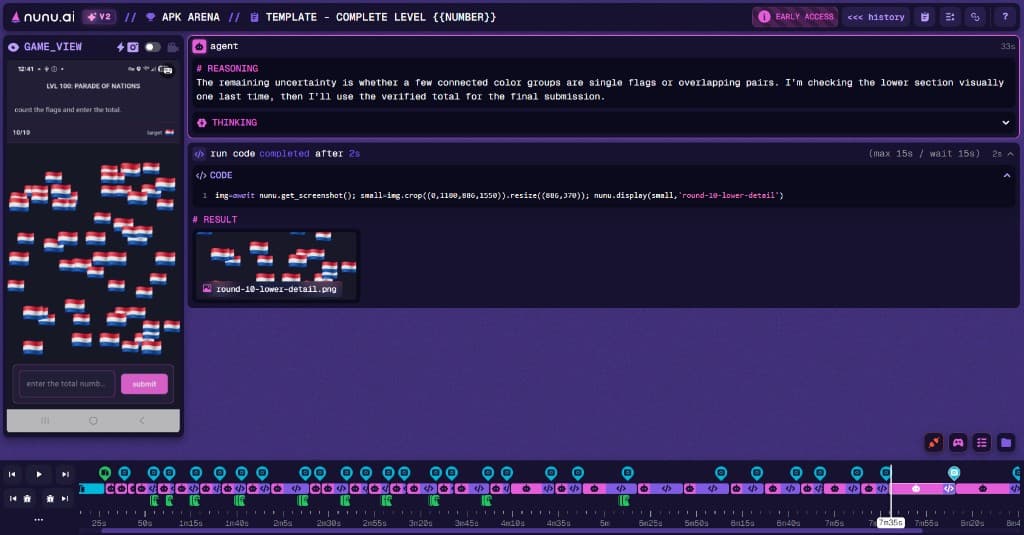
The panels above the timeline provide recorded context such as the current test, checks, to-do list, file system, chat, bugs, and SDK or game state when available. Use them to understand the information available to the agent at the selected time.
| Shortcut | Action |
|---|---|
| Space | Play or pause. |
| ← / → | Move backward or forward through agent activity. |
| Ctrl/Cmd + ← / → | Move between test steps. |
| ↑ / ↓ | Switch timeline lanes. |
| J / K | Jump to the previous or next reported bug. |
| Home / End | Jump to the start or end of the run. |
| V | Switch between screenshots and video. |
| R | Open the report. |
| B | Open bug review when enabled. |
| C | Copy the recording URL at the current position. |
| H | Show all shortcuts. |
See Bug Review for reviewing findings from a recording.