Dashboard
The dashboard is the first thing you see when you open a project. It provides a comprehensive overview of your project. We’ve designed multiple cards to display various insights.
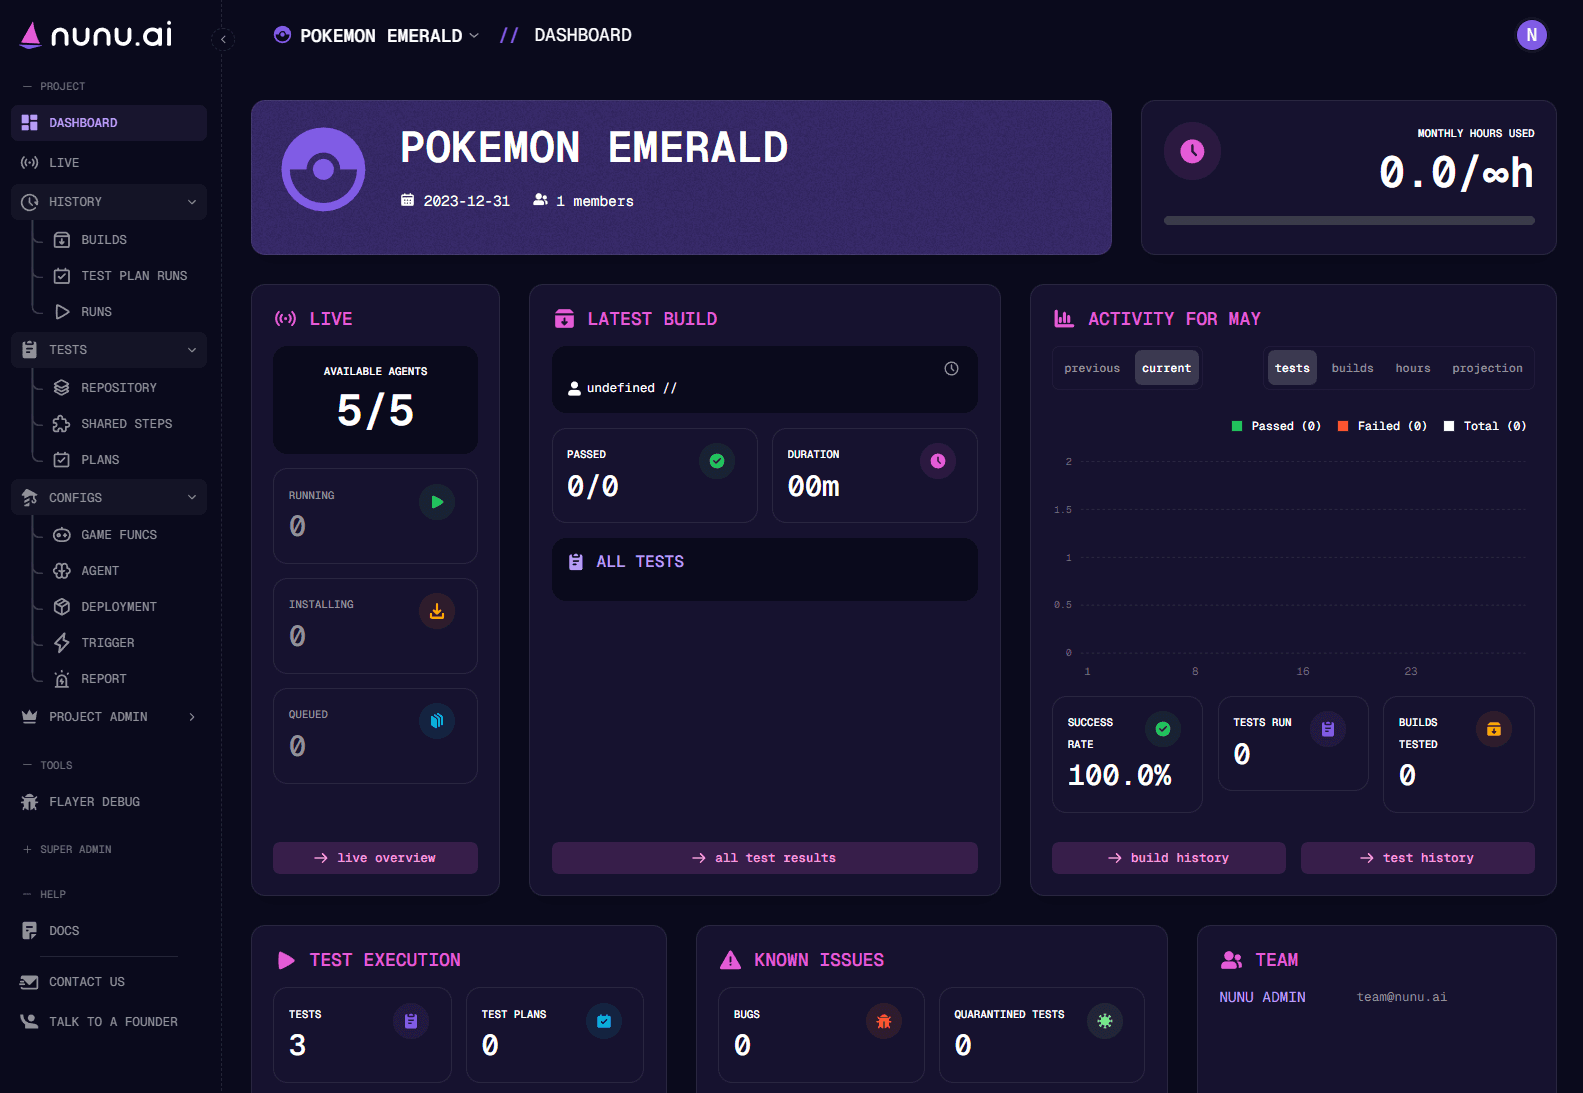
Monthly Hours Used
In the top right of the Dashboard, you can monitor how many AI Agent hours you have available each month and how many you’ve already used during the current month.
This is the number represented in your plan (that you get billed for)! If you exceed your limit, you will not be able to use the AI Agents anymore.
Agents currently working
The live card displays a real-time view of current activity on your project. You can see how many of your AI Agents are available, running tests, or installing new builds to begin testing. You can also check how many tests are in the queue waiting to be executed.
Activity For Current Month
For both the current and previous month, you can track:
- Daily pass/fail rates for your tests
- Number of builds tested each day
- Daily AI agent hours consumption
- A projection of how your AI Agent hours usage